Home › Education
Trading education: guides, metrics and risk management
Everything you need to improve your trading with data: in-depth guides with examples and formulas, and a glossary of the metrics your journal uses. General, educational content, no hype.
Trading guides
- How to keep a trading journal (a complete step-by-step guide)
What a trading journal is, why it is the tool that improves traders the most, and how to build a simple routine to log, review and correct your trading.
- What to log for each trade: a trading journal template
The fields worth recording for every trade, why each one matters and a complete example of a well-documented trade.
- Win rate and risk/reward: how to know if your strategy is profitable
Why a high win rate isn't enough, what risk/reward means, how to calculate your breakeven win rate and worked examples with real numbers.
- Trading expectancy: what it is, the formula and how to calculate it
Expectancy tells you how much you make or lose on average per trade. The formula, examples in dollars and in R, and how to use it to compare setups.
- Drawdown in trading: what it is, how to calculate it and how to recover
What maximum drawdown is, how to calculate it step by step, why recovering a loss takes more than losing it, and how to limit it with simple rules.
- How much to risk per trade: calculating your position size
The 1% rule, the position sizing formula and worked examples in futures (NQ, MNQ, ES, MES), forex and stocks so each trade risks exactly what you decided.
- How to pass a prop firm challenge: rules, drawdown and a risk plan
How prop firm evaluations work, the difference between static and trailing drawdown, and a concrete risk plan to avoid blowing the account.
- How to backtest a trading strategy (without fooling yourself)
What backtesting is, manual versus automated backtests, how many trades you need and the common biases that make a strategy look better than it is.
- The costliest trading psychology mistakes and how to spot them in your journal
Revenge trading, FOMO, overtrading, moving your stop and cutting winners early. How to recognize each mistake, measure what it costs you and build rules to avoid it.
- Profit factor: what it is, how to calculate it and what value is good
Profit factor compares what you make with what you lose. The formula, how it relates to win rate and risk/reward, reference values and its limitations.
Keep your trading journal for free. Zeteo Trades lets you log every trade, see your P&L on a calendar and get win rate, profit factor and drawdown calculated for you.
Start for freeMetrics and key concepts glossary
Performance metrics
Win Rate
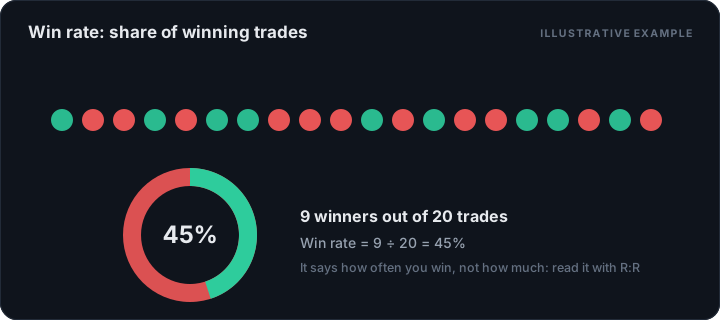
The percentage of winning trades out of your total trades. A high win rate feels good, but on its own it doesn't tell you whether a strategy is profitable.
A 40% win rate can be very profitable if the average win is several times larger than the average loss. That's why win rate should always be read together with risk:reward, never in isolation.
Risk/Reward
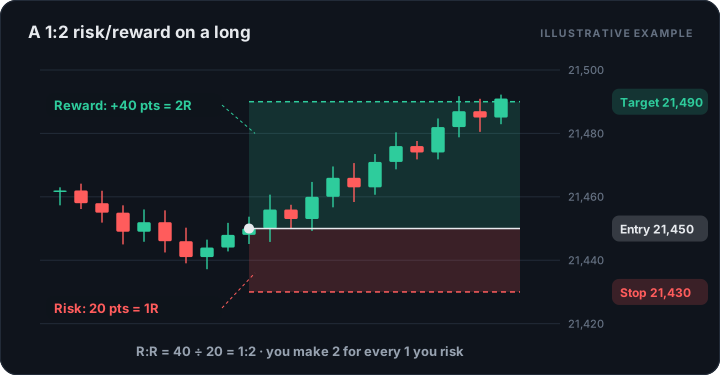
The relationship between what you risk on a trade and what you stand to gain if it works out. An R:R of 1:2 means you're risking 1 to try to make 2.
A good risk:reward ratio lets you be profitable even with a relatively low win rate, because each winner offsets several losers.
Expectancy
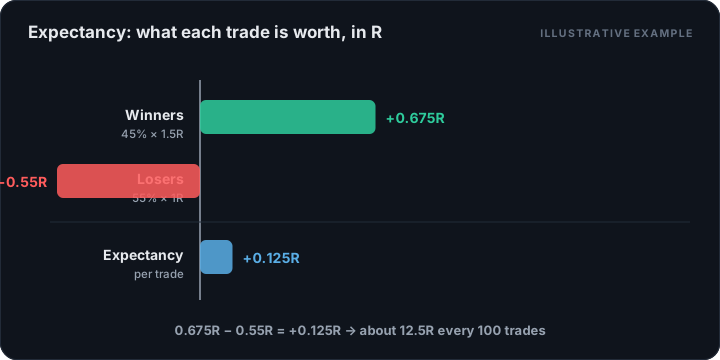
How much you expect to win or lose, on average, per trade based on your history. It's calculated as:
Expectancy = (Win Rate × Average Win) − (Loss Rate × Average Loss)
Positive expectancy suggests your process has historically tended to be profitable. Negative expectancy suggests the opposite. Neither one guarantees future results.
Profit Factor
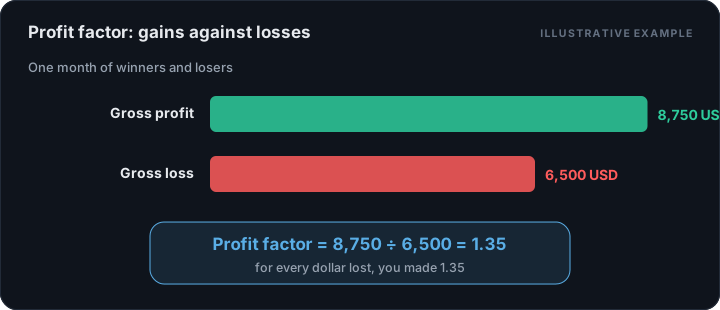
The ratio between total gains and total losses over a period. A profit factor above 1 means gains outweighed losses in that period.
Average R
Your average trade result expressed in multiples of risk (R) instead of dollars. It lets you compare performance across accounts of different sizes without the dollar amount distorting the picture.
Average Win / Average Loss
The average result of your winning trades, and of your losing trades, respectively. The relationship between the two is the real, realized risk:reward of your trading.
Number of Trades
The total count of logged trades over a period. It's key to knowing whether your stats (win rate, expectancy, R:R) are representative or still based on a small sample.
Risk and capital management
Position Sizing
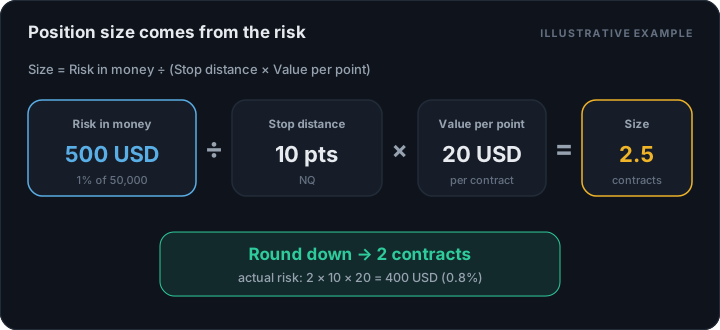
Deciding how many contracts, lots or shares to trade on each position based on your capital and your defined risk. Good position sizing keeps the risk of every trade constant and controlled, no matter how "safe" the entry feels.
Risk Management
The set of rules that define how much capital you risk per trade, per day and overall — including stop losses, daily loss limits, and clear rules for when to stop trading.
Good risk management doesn't prevent losses; it aims to make sure no single loss threatens your account or your ability to keep trading long-term.
Drawdown (Max Drawdown)
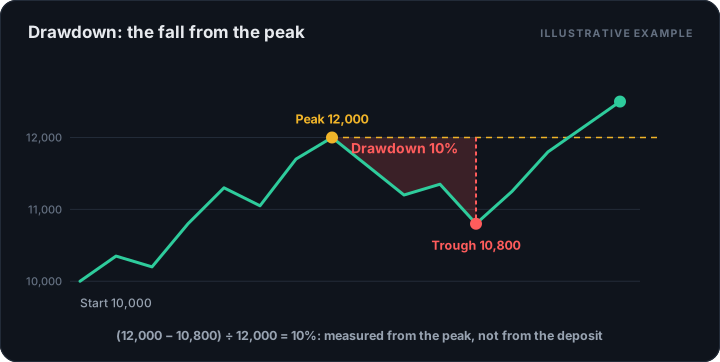
The decline from the highest point of your equity to the lowest point that follows, before recovering. Max drawdown is the largest such decline on record.
It's one of the most important metrics for evaluating a strategy's real risk, beyond its average return.
Losing Streaks
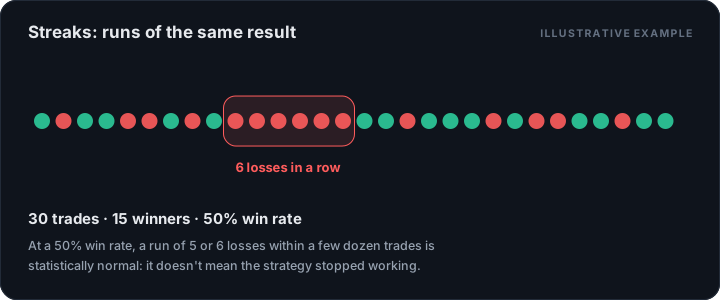
Sequences of consecutive losing trades. Even a strategy with positive expectancy can have long losing streaks — they're statistically expected, not necessarily a sign that something is "broken."
Winning Streaks
Sequences of consecutive winning trades. They tend to breed overconfidence — it's worth checking whether the plan was still being followed during a winning streak, or whether risk quietly crept up.
Sample Size
The number of trades behind a given statistic. Drawing strong conclusions from 10 or 15 trades is very different from drawing them from 200. The fewer trades you have logged, the more caution your own metrics deserve.
Psychology and discipline
Trading Psychology
The study of how emotions — fear, euphoria, frustration, anxiety — affect your entry, management and exit decisions. Logging your emotional state alongside each trade helps surface those patterns over time.
Trading Discipline
The ability to consistently follow your plan and rules, especially when short-term results tempt you to deviate from them. Discipline is measured by comparing what you planned to do against what you actually did.
Emotional Trading
Happens when an entry, management or exit decision is driven by an in-the-moment emotion rather than by rules set in advance. Noticing it isn't always a bad sign — what matters is being able to identify it afterward by reviewing your journal.
Overtrading
Trading more frequently than your plan calls for, often while trying to "make up" for lost time or ride a streak. It's usually associated with higher total risk exposure and a drop in entry quality.
Revenge Trading
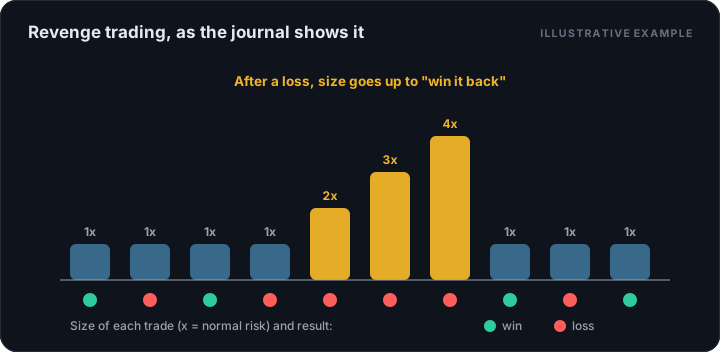
The tendency to jump into a new trade — often without a valid setup — right after a loss, trying to "win it back" quickly. It's one of the costliest patterns, and one of the easiest to spot by reviewing a timestamped journal.
Process and continuous improvement
Journaling
The habit of systematically logging every trade, along with its context, the reasoning behind it, and the outcome. It's the foundation of any improvement process — without your own data, it's very hard to know what's actually working.
Backtesting
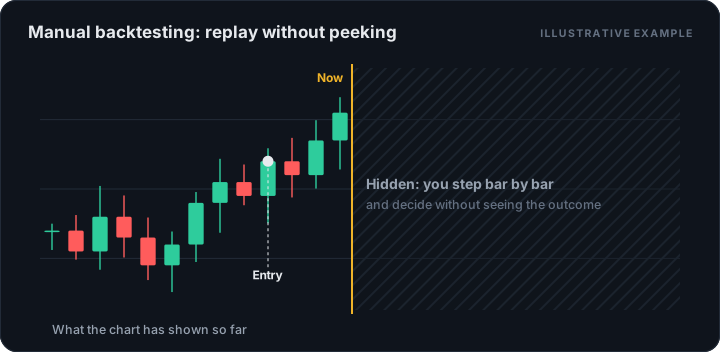
Testing a strategy against historical data to see how it would have performed in the past. Useful for getting an initial read on a strategy, but historical performance does not guarantee future performance.
Forward Testing
Testing a strategy in real time — on a demo account or with reduced risk — before trading it at full size. It complements backtesting because it captures real execution and the emotional component, which backtesting can't measure.
Trading Plan
The document where you define your strategy, your entry and exit criteria, your risk management and your rules of conduct. It serves as an objective reference for judging whether a trade was "good" regardless of whether it made or lost money.
Strategy Rules
The specific, checkable criteria that define when a trade is valid under your strategy: market conditions, required confirmations and invalidation filters. The more objective they are, the easier it is to audit your own consistency.
Educational, general content. Not financial advice or an investment recommendation: trading involves risk of loss.