Win rate and risk/reward: how to know if your strategy is profitable
Why a high win rate isn't enough, what risk/reward means, how to calculate your breakeven win rate and worked examples with real numbers.
"I win 70% of my trades" sounds great. But that sentence alone doesn't tell you whether someone makes or loses money. To know whether a strategy is profitable you need two numbers together: win rate and risk/reward. This guide explains each one, how they relate and how to calculate the minimum win rate you need.
What win rate is
Win rate is the share of winning trades out of all trades:
If you closed 80 trades and 36 were winners, your win rate is 45%. Decide in advance how you'll handle breakeven trades (zero result): the clearest option is to count them separately or exclude them, but always with the same rule.
What risk/reward is
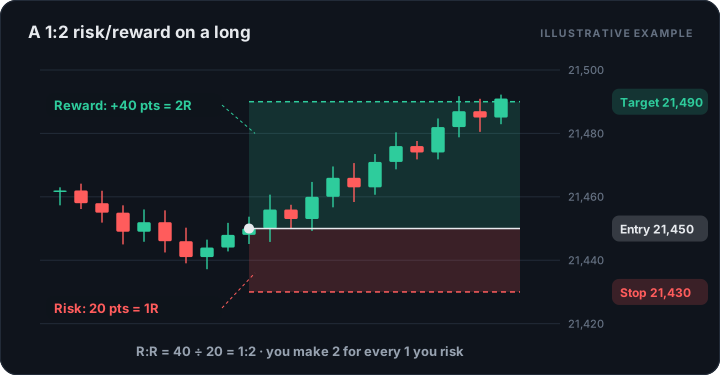
Risk/reward (R:R) compares what you risk with what you aim to make. If your stop is 20 points away and your target 40 points, the R:R is 1:2: you risk 1 to make 2.
There are two versions and both are worth watching:
- Planned R:R: the one you set before entering, with your stop and target.
- Actual R:R: your average winning trade divided by your average losing trade. If you cut winners early or move your stop, the actual figure will be worse than the planned one.
Why one without the other is useless
Look at these two traders, 100 trades each, risking $100 per trade:
| Trader A | Trader B | |
|---|---|---|
| Win rate | 70% | 35% |
| Average win | $40 | $250 |
| Average loss | $100 | $100 |
| Total result | 70 × 40 − 30 × 100 = −$200 | 35 × 250 − 65 × 100 = +$2,250 |
Trader A is right twice as often and loses money. Trader B is wrong almost two out of three times and makes money. The difference is the size of the wins compared with the losses.
The breakeven win rate
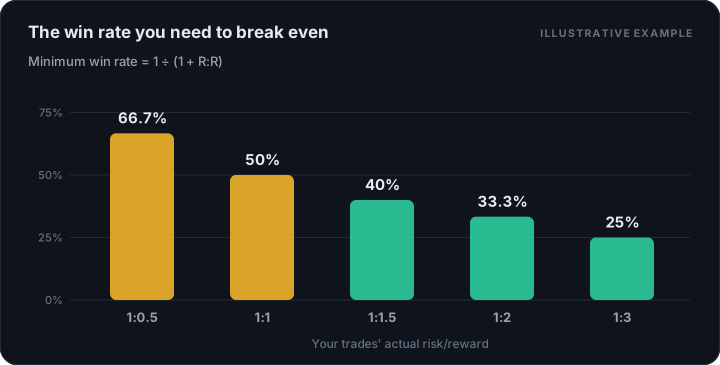
For every risk/reward there's a win rate above which the strategy stops losing (before commissions):
| Risk/reward | Minimum win rate |
|---|---|
| 1:0.5 | 66.7% |
| 1:1 | 50% |
| 1:1.5 | 40% |
| 1:2 | 33.3% |
| 1:3 | 25% |
If your actual R:R is 1:2, any win rate clearly above 33% keeps you in the green. If your actual R:R is 1:0.5 (you make half of what you risk), you need to be right more than two out of three times just to break even.
In practice, add a margin for commissions and slippage, especially if you take many small trades.
The trap at each extreme
Very high win rate with low R:R. It usually appears when winners are closed quickly and losers are allowed to run, or when no stop is used. It works for weeks, and then a single large loss wipes everything out.
Very high R:R with a very low win rate. Targets of 1:5 or 1:10 sound attractive, but they mean long losing streaks. With a 40% win rate, the probability of at least one streak of 5 losses in a row over 100 trades is about 98%, and of a streak of 8 it's close to 49%. You need to be able to survive them, both psychologically and financially.
There's no "correct" combination. What matters is that your win rate and R:R together produce a positive result and fit your personality.
How to measure them properly
- Use a defined stop on every trade. No stop means no R, and no R means no R:R.
- Measure in R, not just dollars. That way you compare trades of different sizes.
- Split by setup. An overall average can hide an excellent setup and another one that's losing you money.
- Gather enough data. With 20 trades, win rate can swing wildly by chance. From 100 trades on it starts to be a reasonable estimate.
Next step: expectancy
Win rate and R:R combine into a single number that tells you how much you make or lose, on average, per trade: expectancy. It's the metric that truly answers whether your strategy has an edge. We cover it in the guide to trading expectancy.