How much to risk per trade: calculating your position size
The 1% rule, the position sizing formula and worked examples in futures (NQ, MNQ, ES, MES), forex and stocks so each trade risks exactly what you decided.
Most accounts aren't lost to a bad strategy but to risking too much on each trade. Position size is the decision that separates a bad streak from a blown account. The good news is that it comes down to a simple formula, and after a few times it becomes automatic.
The core idea: decide the risk before the size
The right order is always this:
- Decide how much money you're willing to lose if the trade fails.
- Decide where the stop goes, based on the chart and your setup (not on how much you want to lose).
- Only then calculate how many contracts, lots or shares to trade so the distance to the stop equals the money you decided to risk.
Doing it backwards (picking the size first and then squeezing the stop so it "doesn't hurt") leads to badly placed stops that get hit by noise.
The 1% rule
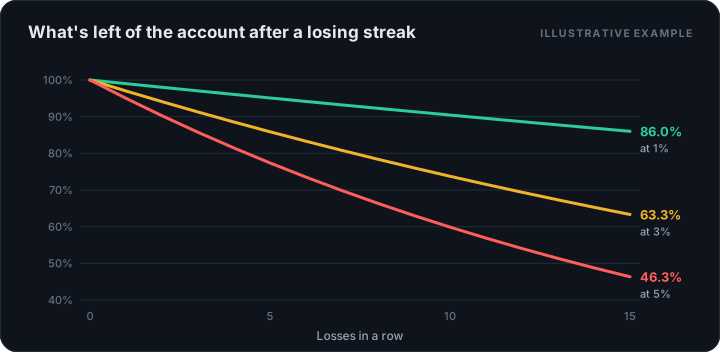
A widely used guideline is to risk no more than 0.5% to 1% of the account per trade. At 1% you need a long string of losses to do serious damage:
| Losses in a row | Drawdown at 1% per trade | At 3% | At 5% |
|---|---|---|---|
| 5 | 4.9% | 14.1% | 22.6% |
| 10 | 9.6% | 26.3% | 40.1% |
| 15 | 14.0% | 36.7% | 53.7% |
Streaks of 5 to 10 losses are normal even in profitable strategies. At 1% you get through them; at 5% they leave the account in a hole that's very hard to climb out of (see the guide to drawdown).
The position sizing formula
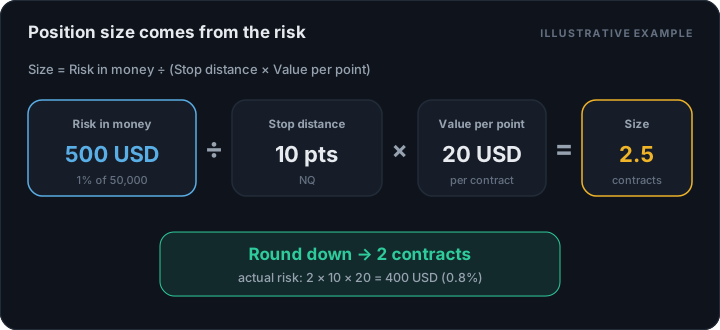
- Risk in money: account balance × risk percentage.
- Distance to stop: how many points, pips or dollars between entry and stop.
- Value per point: how much one unit (a contract, a lot or a share) gains or loses per point of movement.
Always round down. If the math gives 2.7 contracts, you trade 2.
Futures examples
Point values for the most traded Nasdaq 100 and S&P 500 contracts:
| Contract | Value per point |
|---|---|
| NQ (E-mini Nasdaq 100) | $20 |
| MNQ (Micro Nasdaq 100) | $2 |
| ES (E-mini S&P 500) | $50 |
| MES (Micro S&P 500) | $5 |
NQ example. $50,000 account, 1% risk = $500. Stop 10 points away: each contract risks 10 × 20 = $200. Size = 500 ÷ 200 = 2.5 → 2 contracts (actual risk $400).
MNQ example. $5,000 account, 1% risk = $50. Stop 25 points away: each micro risks 25 × 2 = $50. Size = 1 contract. If the stop needed 40 points, a single MNQ would risk $80 (1.6%): in that case it's better to skip the trade or look for an entry with a tighter stop.
ES example. $100,000 account, 0.5% risk = $500. Stop 6 points away: 6 × 50 = $300 per contract. Size = 1.67 → 1 contract. With micros: 6 × 5 = $30 per MES → 16 MES contracts, much closer to the intended risk. That's exactly what micros are for: fine-tuning size.
Forex example
On pairs quoted against the US dollar, such as EUR/USD, one pip is worth roughly $10 per standard lot (100,000 units), $1 per mini lot and $0.10 per micro lot.
$10,000 account, 1% risk = $100, stop 20 pips away: 100 ÷ 20 = $5 per pip → 0.5 lots (5 mini lots).
Stock example
$20,000 account, 1% risk = $200. You buy at $50 with a stop at $47.50: you risk $2.50 per share → 200 ÷ 2.50 = 80 shares. Also check that the total position value (80 × 50 = $4,000) makes sense for your account.
Common mistakes
- Always trading the same number of contracts. If your stop goes from 8 to 25 points, your risk triples even though the size stays the same.
- Ignoring commissions and slippage on very tight stops.
- Raising risk after a loss to "win it back fast".
- Sizing off your starting balance instead of your current one. In a drawdown, 1% of current equity is less money, and that's exactly what protects you.
How to check you're doing it right
In your trading journal, record the planned risk in money and the result in R for every trade. If your losses are almost always close to −1R, your sizing is right. If you see losses of −2R or −3R, something's off: moved stops, adding to losers or miscalculated size.