Trading expectancy: what it is, the formula and how to calculate it
Expectancy tells you how much you make or lose on average per trade. The formula, examples in dollars and in R, and how to use it to compare setups.
If you could keep only one statistic to know whether your strategy works, it should be expectancy. It combines your win rate and the size of your wins and losses into a single number: what you make or lose, on average, every time you take a trade.
The formula
The loss rate is 1 − win rate (if you don't count breakeven trades).
Example in dollars
A trader with these numbers over their last 120 trades:
- Win rate: 45%
- Average win: $300
- Average loss: $200
Expectancy = 0.45 × 300 − 0.55 × 200 = 135 − 110 = +$25 per trade.
If they keep behaving the same way, each trade they take is worth $25 on average. Over 100 trades that's about $2,500, even though the path will include good and bad streaks.
Example in R
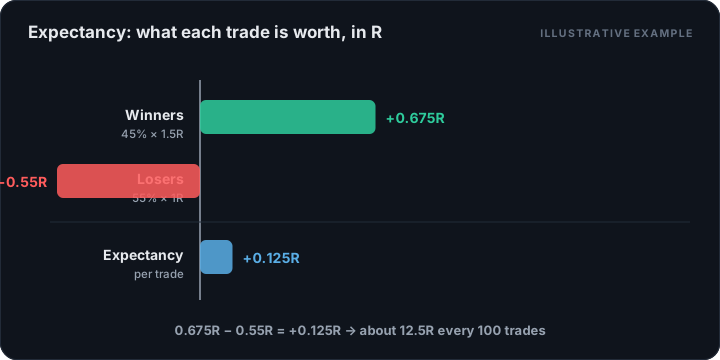
It's even more useful in R (multiples of what you risk). If this trader risks $200 per trade, their average win is 1.5R and their average loss 1R:
Expectancy = 0.45 × 1.5 − 0.55 × 1 = 0.675 − 0.55 = +0.125R per trade.
In R, the number doesn't depend on account size or instrument. An expectancy of +0.125R means that for every 100 trades you expect to make about 12.5 times what you risk on each one.
How to read it
- Negative expectancy: the strategy loses money in the long run. More trades only speed up the loss. Something has to change: the setup, how you exit or the strategy itself.
- Expectancy close to zero: commissions and slippage will probably turn it negative.
- Positive expectancy: there's a statistical edge, as long as the sample is large enough and future conditions resemble past ones.
As a rough reference, many discretionary strategies that work sit between +0.1R and +0.5R per trade. Very high values from few trades are usually luck, not edge.
Why sample size matters
With 15 trades, two or three large results completely change your expectancy. For the number to be reliable you need:
- Many trades of the same setup. 100 is a good minimum; 200 or more is better.
- Comparable conditions. Mixing trades from a trending market with trades from a choppy one can produce an average that represents neither.
- Honest logging. A single large trade left out can flip the sign of the result.
Using expectancy to compare setups
This is where a trading journal becomes really valuable. If you tag each trade with its setup, you can calculate expectancy for each one:
| Setup | Trades | Win rate | Expectancy |
|---|---|---|---|
| Opening range breakout | 64 | 41% | +0.32R |
| Pullback to 20 EMA | 85 | 52% | +0.08R |
| Reversal at highs | 38 | 34% | −0.21R |
With this table the decision is obvious: focus on the first setup, review the second and stop trading the third until you understand what's wrong. Without a journal, you'd most likely keep trading all three equally.
Expectancy and frequency
Your total expected profit also depends on how many trades you take:
An expectancy of +0.3R with 10 trades a month gives +3R a month. One of +0.1R with 60 trades gives +6R, but with more commissions, more screen time and more chances to make mistakes. More trades isn't always better: it only is if each one keeps its quality.
Common mistakes
- Calculating it without commissions. In high-frequency strategies, commissions can be the difference between winning and losing.
- Mixing different risk sizes. If you sometimes risk 1% and sometimes 3%, the dollar average gets distorted. Use R.
- Trusting the number without looking at drawdown. Positive expectancy doesn't protect you from a bad streak; that's what risk management is for.
Summary
Expectancy answers trading's central question: does each trade I take add or subtract? Calculate it in R, by setup and with a large enough sample. It's the best tool for deciding what to keep doing and what to drop.