What to log for each trade: a trading journal template
The fields worth recording for every trade, why each one matters and a complete example of a well-documented trade.
The most common question when starting a trading journal is what to write down. Log too little and you won't be able to analyze anything later. Log too much and you'll give up. This template aims for the middle: enough data to calculate every important statistic and find patterns, without turning each trade into paperwork.
Trade data
These are the objective facts. They feed your result, win rate, risk/reward and drawdown.
| Field | Example | Why it matters |
|---|---|---|
| Entry date and time | Oct 6, 10:12 | Find your good and bad hours |
| Exit date and time | Oct 6, 10:47 | Measure how long trades last |
| Instrument | NQ (Nasdaq 100 futures) | Compare results by market |
| Direction | Short | See whether you do better long or short |
| Entry price | 31,610.50 | Result calculation |
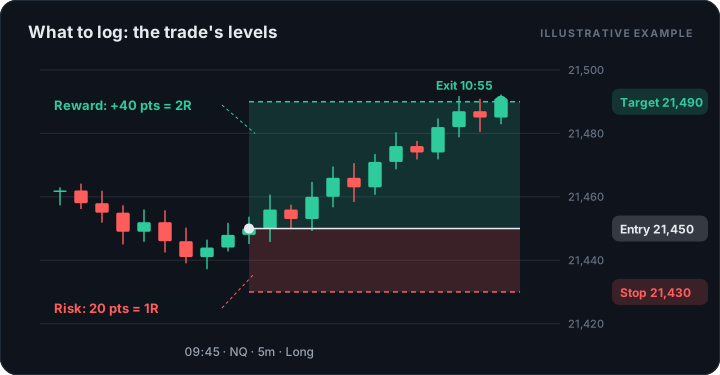
| Initial stop loss | 31,630.50 | Defines your risk (1R) |
| Target | 31,570.50 | Planned risk/reward |
| Exit price | 31,570.50 | Actual result |
| Size | 1 contract | Risk in money |
| Commissions | $4.50 | Net result |
The initial stop loss is the most important field and the one most often skipped. Without it you can't know how much you risked, and without defined risk there's no way to measure the quality of your trades.
Result in money and in R
Besides the dollar result, log the result in R: multiples of what you risked. If you risked $400 and made $800, the result is +2R. If you lost $200, it's −0.5R.
Measuring in R has a big advantage: it makes trades of different sizes, instruments and account stages comparable. A $100 win says nothing; a +2R win says a lot.
Process data
This is what teaches you the most, and what your broker will never give you.
- Setup: the name of the pattern or reason for entry (for example "opening range breakout" or "pullback to the 20 EMA"). Always use the same names so you can compare.
- Did you follow the plan? Yes or no. It's the most honest statistic you'll have.
- Execution quality: early, on-time or late entry; exit by plan or out of fear.
- Market context: trending, ranging, news day. One line is enough.
Emotional data
It may sound soft, but this is where many of the most expensive mistakes show up. Pick one dominant emotion from a short, fixed list: calm, anxious, impatient, euphoric, fearful, frustrated. Over time you may see, for example, that your "impatient" trades have a far lower win rate than the rest.
Add a short note, one or two sentences, about what you were thinking at the time. No essays needed.
Chart screenshot
An image of the chart with the entry, stop and exit marked is worth more than any description. During review it shows whether the trade really met your setup or whether you forced it. Take it when the trade closes, on the timeframe you used to decide.
Tags
Tags are the fastest way to find patterns. Some useful ones:
- Mistakes: moved stop, late entry, overtrading, revenge, early exit.
- Context: news, open, Friday, after a loss.
- Quality: A+, B, C depending on how well it matched the setup.
Then you can filter: how much did your revenge trades cost you this month? That number is usually the best argument for change.
A complete example
With 100 entries like this you can answer questions worth a lot: what your best setup is, which hours lose you money, how much ignoring your plan costs and whether your actual risk/reward matches the planned one.
How not to quit
- Use dropdowns and fixed values instead of free text whenever you can.
- Log as soon as you close the trade.
- Let a tool calculate the result, the R and the statistics; you only fill in what only you know: the reason, the emotion and the note.
To learn how to use this data, continue with the guide on win rate and risk/reward.