Profit factor: what it is, how to calculate it and what value is good
Profit factor compares what you make with what you lose. The formula, how it relates to win rate and risk/reward, reference values and its limitations.
Profit factor is one of the simplest ways to sum up a strategy: it compares everything you made with everything you lost. It's easy to calculate, easy to read and shows up in almost every performance report. But like any metric, it has traps.
The formula
- Gross profit: the sum of all winning trades.
- Gross loss: the sum of all losing trades, as an absolute value.
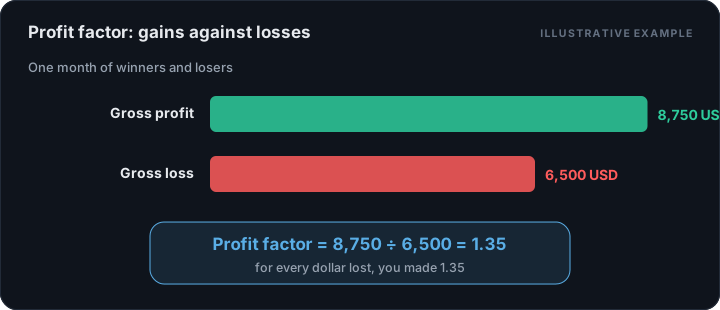
Example: in one month your winners add up to $8,750 and your losers to $6,500. Profit factor is 8,750 ÷ 6,500 = 1.35. For every dollar lost, you made 1.35.
How to read it
| Profit factor | General reading |
|---|---|
| Below 1 | The strategy loses money |
| 1 to 1.2 | Very thin: commissions can turn it negative |
| 1.2 to 1.5 | Moderate edge |
| 1.5 to 2 | Solid edge |
| Above 2 | Very good, but check the sample size |
These are guidelines, not rules. A profit factor of 3 over 15 trades says very little; one of 1.4 over 300 trades is far more reliable.
How it relates to win rate and risk/reward
Profit factor can be calculated from win rate (W) and actual risk/reward (R):
Some examples:
| Win rate | Actual R:R | Profit factor |
|---|---|---|
| 40% | 1:2 | 1.33 |
| 50% | 1:1.5 | 1.5 |
| 60% | 1:1 | 1.5 |
| 35% | 1:3 | 1.62 |
| 70% | 1:0.4 | 0.93 |
The last row shows the classic case of a high win rate that loses money: you're right a lot, but the losses are much bigger than the wins. More on this in win rate and risk/reward.
Profit factor and expectancy
The two metrics answer similar but different questions:
- Expectancy tells you how much you make on average per trade (in money or in R).
- Profit factor tells you by what ratio your wins exceed your losses.
Two strategies can share the same profit factor and have very different expectancies if one risks much more per trade. To compare setups, expectancy in R is usually more useful; profit factor is a good quick health check.
Limitations
- It says nothing about drawdown. A strategy with a 1.8 profit factor may have gone through a 40% decline along the way.
- It's sensitive to outliers. A single huge win can inflate the number and hide that the rest of the trades lose. Try calculating it without your best trade: if it drops below 1, your "edge" depends on a rare event.
- It ignores frequency. A profit factor of 2 with three trades a year produces little money.
- It depends on how you count costs. Always calculate it with results net of commissions.
How to use it in your journal
- Look at it per setup, not just overall. A setup with a 0.8 profit factor can be eating the profits of another one at 1.9.
- Look at it per period. If it falls month after month, something changed: the market or your execution.
- Always pair it with maximum drawdown and the number of trades.
Summary
Profit factor divides what you made by what you lost. Above 1 the strategy makes money, above 1.5 the edge is solid, always with a large enough sample and costs included. Use it as a quick gauge, together with expectancy and drawdown, to get a complete picture of your trading.