Drawdown in trading: what it is, how to calculate it and how to recover
What maximum drawdown is, how to calculate it step by step, why recovering a loss takes more than losing it, and how to limit it with simple rules.
Drawdown measures how far your account can fall from its best point. It's probably the statistic that matters most for survival in trading, because it doesn't measure how much you can make but how much loss you can withstand. And in trading, staying in the game is the precondition for everything else.
What drawdown is
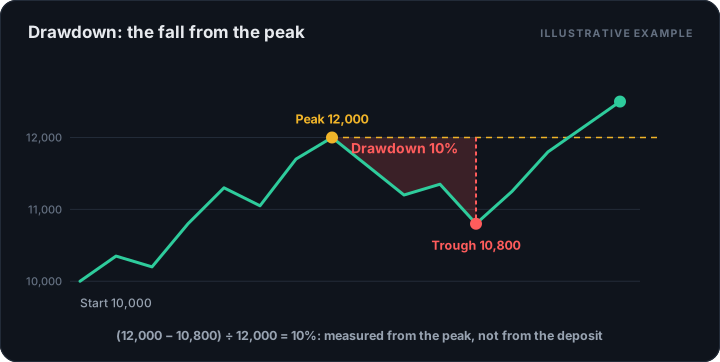
Drawdown is the decline in capital from a previous peak to a later low, before a new peak is reached. It's expressed in money or, more usefully, as a percentage.
Maximum drawdown is the largest such decline over the whole period you analyze.
How to calculate it
- Follow your equity curve trade by trade.
- At each point, note the highest value reached so far.
- Calculate the difference between that peak and your current equity.
- Maximum drawdown is the largest of those differences.
Example: you start with $10,000, reach $12,000, drop to $10,800 and then climb to $12,500. Maximum drawdown is (12,000 − 10,800) ÷ 12,000 = 10%, even though you were never below your starting balance.
This matters: drawdown is measured from the peak, not from your deposit. Many traders are surprised because they "didn't lose money", yet they gave back a big part of what they had made.
The asymmetry of losses
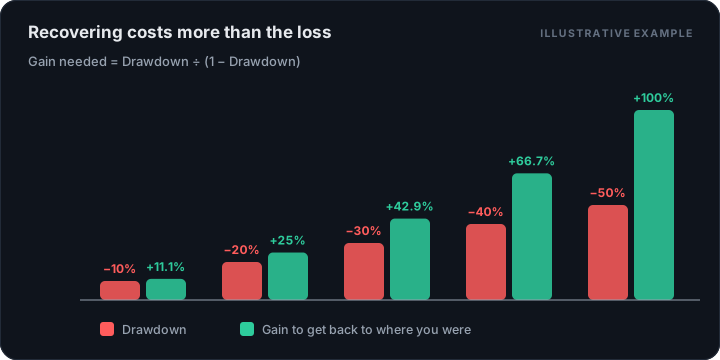
Recovering from a decline takes a larger percentage gain than the percentage lost, because you're starting from a smaller balance:
| Drawdown | Gain needed to recover |
|---|---|
| 5% | 5.3% |
| 10% | 11.1% |
| 20% | 25% |
| 30% | 42.9% |
| 40% | 66.7% |
| 50% | 100% |
| 75% | 300% |
Up to 10–15% the difference is manageable. From 30% it becomes very hard, and at 50% you have to double the account just to get back to where you started. That's why the priority of risk management is avoiding deep drawdowns, not maximizing gains.
Why drawdowns are unavoidable
Even a strategy with a real edge will have losing streaks. With a 50% win rate, the probability of at least 5 losses in a row over 100 trades is about 81%. It's not a remote possibility: it's what you should expect.
If you risk 1% per trade, 5 straight losses are roughly a 5% drawdown. If you risk 5% per trade, the same streak leaves you at nearly −23%. The streak is the same; the size of the risk makes the difference.
Your strategy's drawdown and your tolerable drawdown
There are two different numbers worth knowing:
- Your strategy's historical drawdown, which comes from your journal or a backtest.
- The drawdown you're willing to tolerate, which depends on your capital, your goals and, if you trade a funded account, the firm's rules.
A practical rule: assume you'll see a larger drawdown in the future than the worst one in the past. If your strategy's maximum drawdown was 12% over 200 trades, plan to withstand something close to 20%.
How to limit drawdown
- Small, fixed risk per trade. Between 0.5% and 1% is common among traders who protect their capital. See how much to risk per trade.
- Daily loss limit. For example, stop trading after losing 2R or 3R in a day. It cuts tilt days short before they turn into disasters.
- Weekly or monthly limit. If you hit a certain drawdown, halve your size until you make a new high.
- Never increase risk to recover. Doubling size after a loss is the fastest way to turn a normal drawdown into an unrecoverable one.
Drawdown duration
It's not just how far the account falls, but how long it takes to get back to a new high. A strategy that goes four months without a new peak can be profitable in the long run, yet very hard to stick with emotionally. Look at your equity curve for the longest stretch without a new high: it's a good indicator of how much patience you'll need.
Summary
Drawdown measures the fall from the peak, and it's the statistic that decides whether you can keep trading. Big losses cost far more to recover than they seem, and bad streaks are a normal part of any strategy. Control it with small fixed risk, daily limits and the decision to never increase size to "win it back".